5.00 out of 10 votes

Digital Couponing Habits Statistics
 By Razvan PopescuUpdated 6 min read
This is the last part of our report about the online shopping and digital couponing habits of US consumers, based on a survey of 1,280 respondents that we conducted via MakeOpinion.com. Find out the most popular product categories for which consumers use coupon codes, and how much money they tend to save.
⚠️
Attention: This is part 3 of 3 of our series covering digital spending and couponing habits in 2024. The insights were gathered via a survey of 1,280 consumers from the United States. Check out all parts of our research, or continue reading the full details below.
- Online Shopping Statistics
- Online Couponing Trends & Statistics
- Digital Couponing Habits (you are here)
Key Takeaways
- Customers most often use discount codes for clothes & accessories (53%), electronics & gadgets (44%), and health & wellness (40%).
- Over a third of respondents save $10-$25 a month using coupons when purchasing products from the 3 categories above.
- 68% of respondents say they generally find coupons for the products they want to purchase online.
- 66% of shoppers have made impulse buys because coupons were available.
- 71% of customers have switched to a competitor’s offer because they offered a better discount code.
How Customers Use Digital Coupons
The products that customers shop for online most often are:
- Clothes & Accessories: 63%
- Electronics & Gadgets: 46%
- Health & Wellness: 43%
Fun fact: they’re the same product categories for which our respondents use coupons most often as well (53%, 44%, and 40% respectively). Takeout food and groceries & meal kits are up there too, with 39% and 40% of respondents using coupons to buy them.
✏️
Note: Unsurprisingly, people use the most coupons for the products that they purchase most often. However, saving amounts can vary a lot.
How Customers Save with Digital Coupons
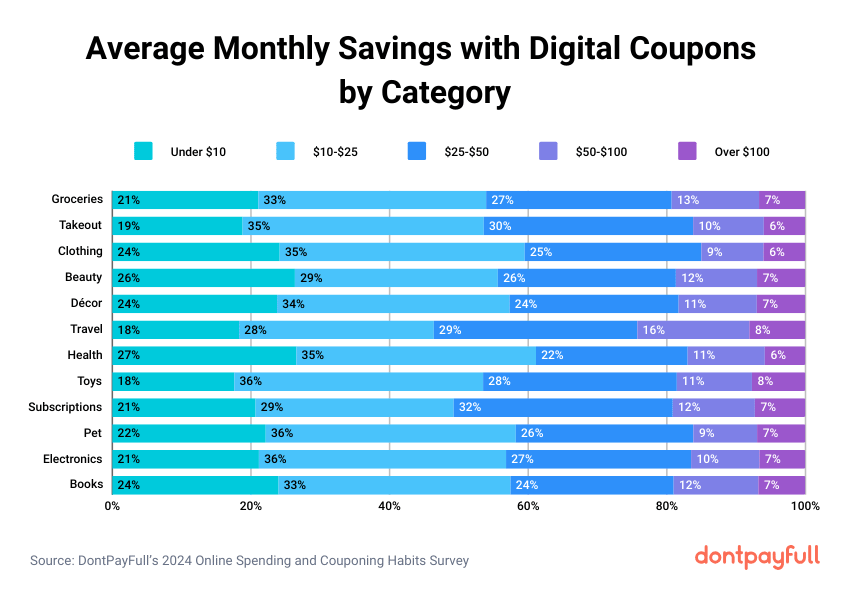
- Over a third of respondents report saving $10-$25 per month using digital coupons in the most popular categories mentioned above (clothes & accessories, electronics & gadgets, health & wellness).
- Most people save relatively modest amounts with digital coupons on health products and books/ebooks. Over a quarter save less than $10 per month in these categories.
- Digital subscriptions have a notably high percentage of respondents (31%) saving between $25 and $50, which may be influenced by subscription services offering significant discounts for longer-term commitments.
- The highest percentage of savings in clothing and accessories is seen in the “less than $10 savings” category (24% of respondents). This shows that even though coupons are used, the savings per purchase could be smaller.
- Travel has the highest percentage of respondents (8%) saving more than $100, likely due to the higher overall cost of travel bookings compared to other categories.
- The highest average monthly savings are found in travel ($37), digital subscriptions ($34), and toys, video games & games categories ($33).
- Most respondents say that they generally find the coupons that they need for their preferred products and services (68%).
| Category | Avg. Savings per Month | Avg. Savings per Year |
|---|---|---|
| Travel | $37.06 | $444.70 |
| Digital Subscriptions | $34.06 | $408.77 |
| Toys, Video Games, Games | $33.48 | $401.80 |
| Groceries and Meal Kits | $32.98 | $395.81 |
| Takeout Food | $32.00 | $384.06 |
| Books, E-books | $31.84 | $382.04 |
| Beauty | $31.83 | $382.01 |
| Home Decor | $31.67 | $380.10 |
| Electronics and Gadgets | $31.34 | $376.03 |
| Pet Items | $30.90 | $370.76 |
| Health | $29.79 | $357.48 |
| Clothing and Accessories | $29.72 | $356.69 |
Impulse Buys from Finding Digital Coupons
66% of respondents have made an impulse buy because they found a digital coupon for the product. Out of those, the most likely generations to make an impulse buy are Millennials (41%) and Gen X (27%). On the flip side, the Silent Generation and Baby Boomers are least likely to make impulse buys.

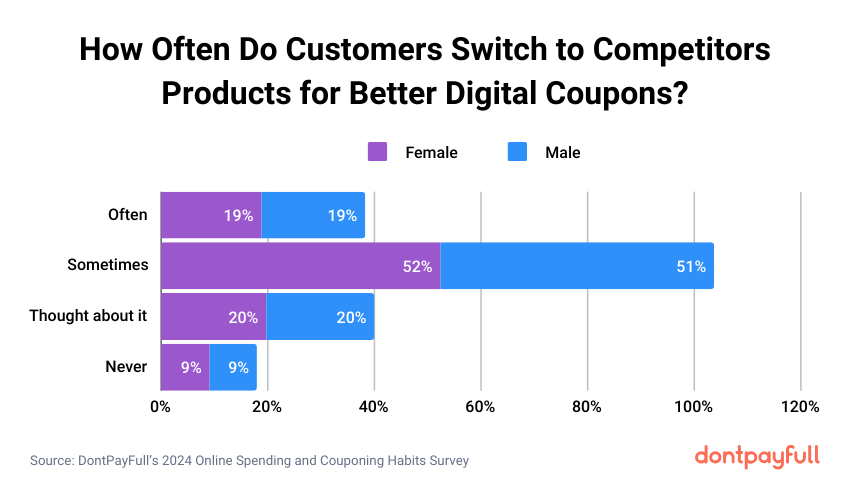
Competitor Switching Frequency for Better Digital Coupons
Most customers (71%) have chosen a competitor’s product over the one they initially considered because the competitor offered a better digital coupon. 19% claim to do so frequently as well. Interestingly, unlike differences between men and women when it comes to finding coupons on various platforms, in this case, both men and women are equally likely and unlikely to make impulse buys.
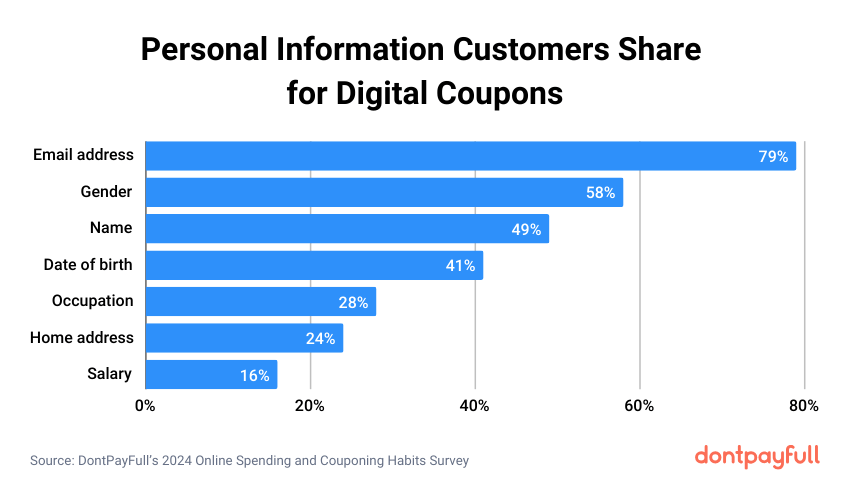
Personal Information Customers Share for Digital Coupons
Customers have varying degrees of flexibility relating to what personal information they would trade for a digital coupon. For example:
- 79% would give their email address
- 58% would reveal their gender
- 49% would give their name
- 41% would give their date of birth
- 28% would reveal their occupation
- 24% would give their home address
- 16% would reveal their salary
✏️
Note: Surprisingly, more people are willing to reveal their home address in exchange for a coupon code than those willing to share their salary.
Digital Coupons Sharing
50%+ respondents have encountered challenges when using digital coupons. For example (keep in mind respondents selected all applicable answers):
- 66% say the coupons they try using just don’t work
- 54% say the coupons they find are expired
- 60% say the coupons they find are only valid in certain circumstances
51% of people share their digital coupons with friends and family. Bear in mind that some coupons are single-use and expire afterward.

Who We Surveyed
- The survey respondents are roughly evenly spread between Generations X and Y, which are the majority of our respondents (with fewer members of Generation Z being present as well). 21% are 25-34 years old, 20% are 35-44, and 20% are 45-54.
- 49% of survey respondents are men, and 51% are women.
- 57% of respondents have completed a higher form of education, and all respondents have at least a high school degree.
- 66% of respondents were employed in some way at the time of the survey, 14% were retired, 15% were unemployed, and 5% were students.
- Most respondents have a household income of $50,000-$99,999 per year, while 24% earn less than $25,000 in their household. 19% earn more than $100,000 per year.
- Most respondents were either single (38%) or married (37%) at the time of the survey.
- Most respondents either did not have children (44%), had 1 child (21%), or had 2 children (21%) at the time of the survey.
Survey Raw Data Request
Want to look at the data yourself? Just click the button below and tell us your email address and what you need the data for. We’ll then give you the questions and answers in CSV format.
Want to Learn More?
If you’ve found the insights interesting, we’re happy to tell you that there’s more where they came from! Continue exploring online shopping and couponing habits by reading all parts of our study:
- Online Shopping Statistics
- Online Couponing Trends & Statistics
- Digital Couponing Habits (you are here)
Do You Have Any Suggestions?
We're always looking for ways to enrich our content on DontPayFull.com. If you have a valuable resource or other suggestion that could enhance our existing content, we would love to hear from you.
Was this content helpful to you?
Related Articles