5.00 out of 14 votes

Online Coupon Statistics & Trends
 By Razvan PopescuUpdated 19 min read
We’ve surveyed 1,280 consumers from the United States via MakeOpinion.com to find out how they search for digital coupons, how much time they spend doing it, how often the coupons that they find actually work, and more. This is a complete breakdown of our findings.
⚠️
Attention: This is part 2 of 3 of our series covering digital spending and couponing habits in 2024. The insights were gathered via a survey of 1,280 consumers from the United States. Check out all parts of our research, or continue reading the full details below.
- Online Shopping Statistics
- Online Couponing Trends & Statistics (you are here)
- Digital Couponing Habits
Coupon Statistics: Key Takeaways
- Most customers want to save 10-30% of their shopping cart with a coupon. This means that the majority expect to save an average of $15 a month. In practice, most respondents save $10-$25 per month thanks to digital coupons.
- Households with more children have higher costs. This means that those households save more money with percentage-off discounts than households without children.
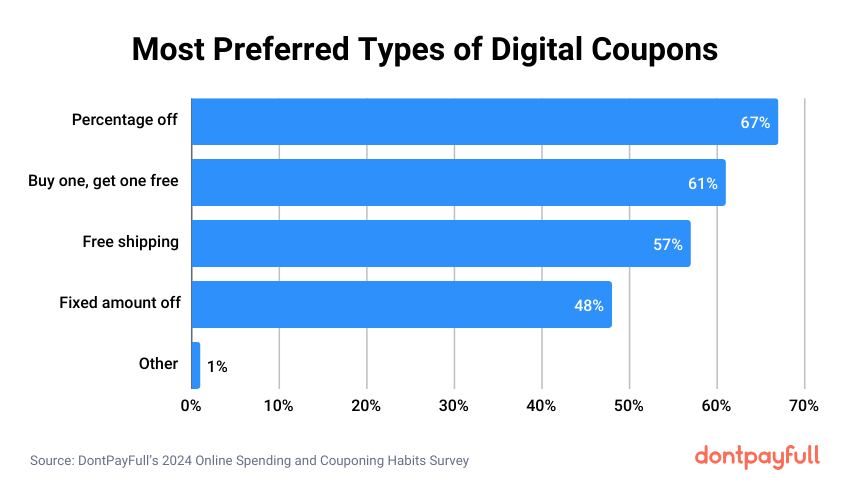
- There’s a relatively even split between which coupon types people prefer: 61% like “Buy One, Get One” (BOGO) deals, 57% like free shipping, 67% want percentage-off codes, and 48% would rather take flat discounts.
- The majority of survey respondents look for coupons for less than 50% of their total monthly purchases. So, on average, customers want discounts for ~2 online purchases/mo.
- About 25% of the lowest income bracket of respondents always use coupons. Only around 10% of middle-income respondents always use coupons, and only about 7% of the high-income bracket.
- Most people spend 5-10 minutes searching for coupons online per purchase. However, the general time spent looking for coupons varies from under 5 minutes to up to 20 minutes.
- The more monthly online purchases a customer makes, the more time they spend looking for digital coupons for every purchase. For example: 9% of shoppers buying 1-2 times a month spend 20-30 minutes looking for coupons. However, when purchasing online 11-15 times a month, 19% of shoppers spend 20-30 minutes looking for coupons.
- Coupon codes work 10-30% of the time for 26% of shoppers, which is the highest percentage in this bracket. 30-50 minutes spent looking for coupons results in a 50-90% chance of the codes working, but 54% of respondents spend less than 10 minutes.
- 85% of people use coupons in the United States. Respondents predominantly use search engines and coupon websites to find promo codes.
- 5% of respondents always abandon their shopping cart if they can’t find a discount, while 15% will never do so. 10% abandon their cart “often,” 33% do it “sometimes,” and 37% do it “rarely.”
Customers’ Discount Expectations
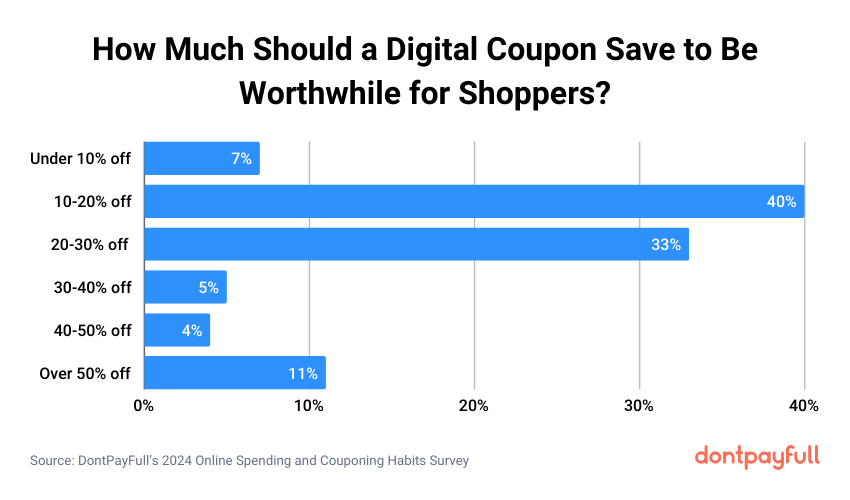
Most respondents indicated that a coupon should save them between 10-30% of their shopping cart in order to be worthwhile to search for one and use it. Considering that most respondents spend an average of $75 a month on online purchases, this means that this group expects to save around $15 a month by using digital coupons.
✏️
Note: Based on the data about coupon statistics so far, we can correlate that the likeliest scenario is that our respondents expect to save around $15 a month on purchases for either clothes & accessories, electronics & gadgets, or health & wellness products.
Here’s a full breakdown of how big of a discount our respondents want for their entire shopping cart:
- Under 10% savings: 7%
- 10-20% savings: 40%
- 20-30% savings: 33%
- 30-40% savings: 5%
- 40-50% savings: 4%
- Over 50% savings: 11%
✏️
Note: One interesting aspect is that the most common expectation is a 10-20% discount, relatively closely followed by up to 30%. However, the amount of people wanting a higher discount than that drastically reduces until the amount surpasses 50%.
This indicates that the expectation of how much a discount should be is pretty moderate, but if it’s possible to find a higher-than-usual discount, customers expect significant savings (over 50%).
Average Monthly Savings via Couponing
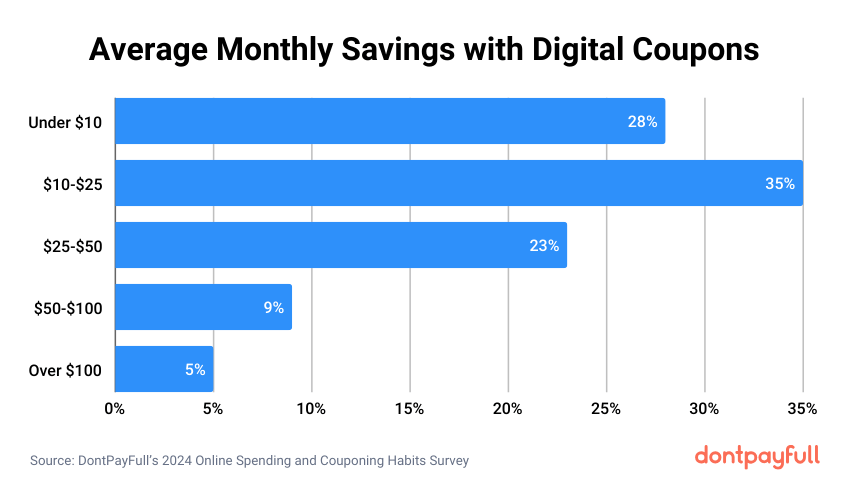
In line with the savings expectations outlined above, most respondents keep an extra $10-$25 in their pockets thanks to digital coupons. The full breakdown is as follows:
- Under $10: 28%
- $10-$25: 35%
- $25-$50: 23%
- $50-$100: 9%
- Over $100: 5%
Naturally, the more expensive a product will be, the bigger the savings offered by a percentage discount offer. Considering that the most popular product categories of our survey can have items at wildly different prices and that some respondents come from high-income households, it is entirely plausible that significant monthly discounts ($100+) are achieved via coupon codes, too.
✏️
Note: Monthly savings through coupons are also affected by the number of children a person has. The more children in the household, the higher the overall costs, which also raises the amount that a percentage discount helps them keep in their wallets.
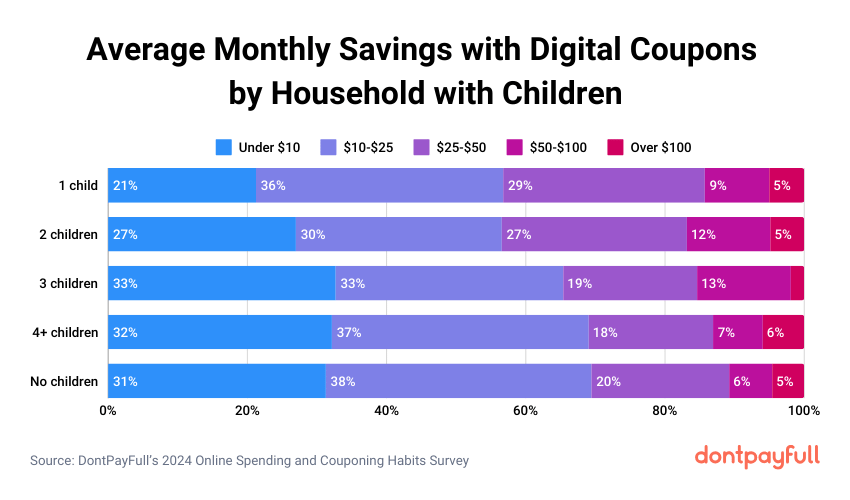
Average Monthly Savings via Couponing by Household with Children
Households with no children are the most likely to save $10-$25 per month using digital coupons (38%), while those with 4 or more children are close behind at 37%. Households with 1 child fall in the middle at 36% for this savings level. It’s interesting to note the similarities in savings between no children and 4+ children, which could be for reasons such as:
- Households with 4+ children likely need the savings more than a household with no children, but the available time to search for said discounts is much lower.
- Childless households might be saving up for a planned future and thus avoid spending, while households with 4+ children might avoid spending to build up a safety net fund.
✏️
Note: Households with 2-3 children are more likely than those with 0-1 or 4+ children to save $50-$100 monthly with coupons. 12% of 2-children households and 13% of 3-children households reach this savings tier. Households with 4 or more children actually have the highest share of less than $10 monthly savings (32%). This goes against the conventional wisdom that larger households would be the biggest coupon clippers.
Favorite Online Coupon Types
We’ve asked our respondents to select all the promo code types that they prefer using. Percentage-off coupon codes came on top as the most liked ones, but not by a large degree. Overall, it is clear that offering diverse savings opportunities is the way forward.
- “Buy One, Get One” (BOGO) deals are popular as they provide cost savings for bulk purchases, create opportunities for trying new products, and make products more worthwhile to purchase by adding an additional benefit.
- 80% of customers expect free shipping depending on order size, based on a JungleScout report from 2021, and 66% think that it should be part of all online orders.
- Percentage-off codes are popular as they become greater the more expensive a shopping card is.
- Flat discounts are popular as the amount of cash saved is obvious and transparent.
Coupon Searching Habits
Most survey respondents search for discounts for less than half of their purchases per month. As most respondents shop online 3-5 times a month (37%) or 1-2 times a month (31%), this means that customers look for discounts for an average of 2 purchases a month.
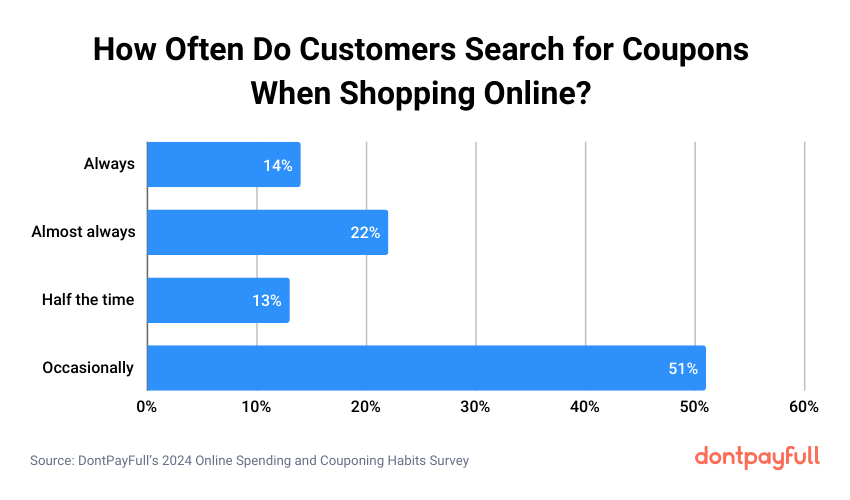
Here’s how often shoppers look for digital coupons when buying online:
- Always: 14%
- Almost always: 22%
- Half the time: 13%
- Occasionally: 51%
The percentages above only include respondents who look for coupons in some capacity when buying online. Overall, 15% of respondents say they never search for coupons for digital purchases, but that still means that coupons are important for an overwhelming majority of US shoppers (85%).
✏️
Note: Customers mostly fall into two broad categories. Those who’d like a discount every now and then, and those who hunt for bargains consistently. We can infer this as the amount of people looking for a discount almost all the time or always is higher than the amount of people who look for coupons only half of the time.
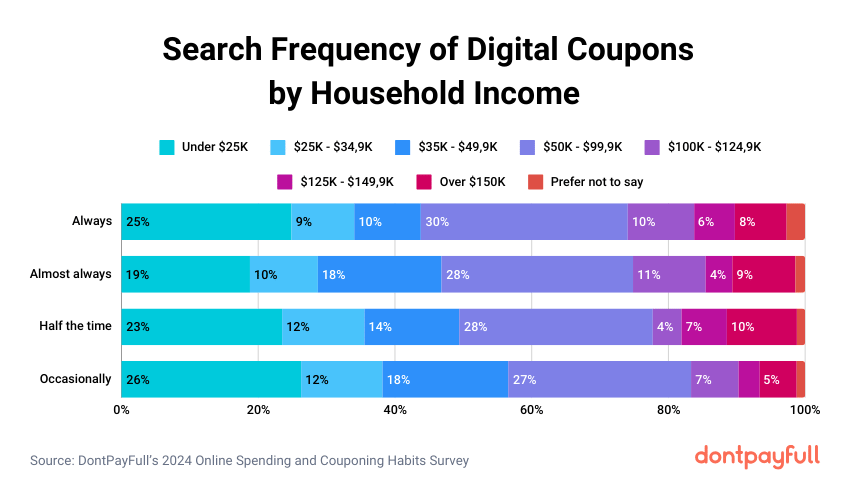
Coupon Searching by Household Income
Low and Middle-Income Shoppers
Nearly 25% of the lowest income bracket (less than $25,000 per year) say they always use coupons. However, only around 9-10% of middle-income brackets ($25,000-$49,999 per year) always use coupons. Interestingly, the $50,000-$99,999 per year income level has a higher rate of always using coupons (30%) than the middle-income brackets.
In fact, the $50,000-$99,999 and under $25,000 income levels have the highest percentages of looking for coupons across the board (for all answers: occasionally, half of purchases, almost every time, always).
✏️
Note: This suggests that both the lowest and more middle-class income brackets are heavy coupon users. The lowest income bracket is likely looking to save every possible dollar as their spending power isn’t as high. Customers in the upper-middle-class tier are likely interested in maintaining their financial status by saving money on purchases whenever possible.
Highest-Income Shoppers
Highest-income households seem to use coupons more strategically and selectively. Only 6-10% of the highest income brackets ($100,000-$150,000+) always use coupons, with just 3-5% using them occasionally. This might indicate that daily purchases are not a financial concern, with coupon hunting being reserved for costlier, rarer purchases.
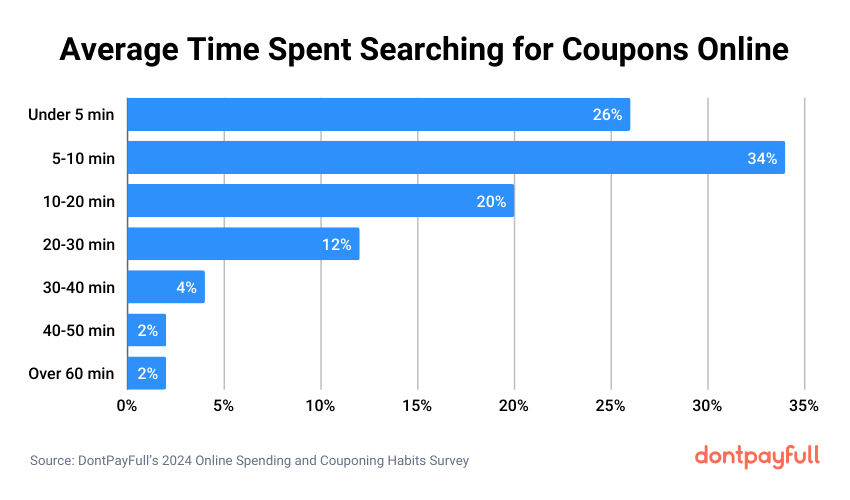
Time Spent Searching for Coupons Online
Most respondents spend 5-10 minutes hunting for coupons, but the average time spent is spread relatively evenly among the top 3 answers below. As such, we can say that customers usually spend between less than 5 minutes and up to 20 minutes searching for a digital coupon.
Here’s a breakdown of how much time our survey participants spend looking for coupons:
- Under 5 minutes: 26%
- 5-10 minutes: 34%
- 10-20 minutes: 20%
- 20-30 minutes: 12%
- 30-40 minutes: 4%
- 40-50 minutes: 2%
- Over 60 minutes: 2%
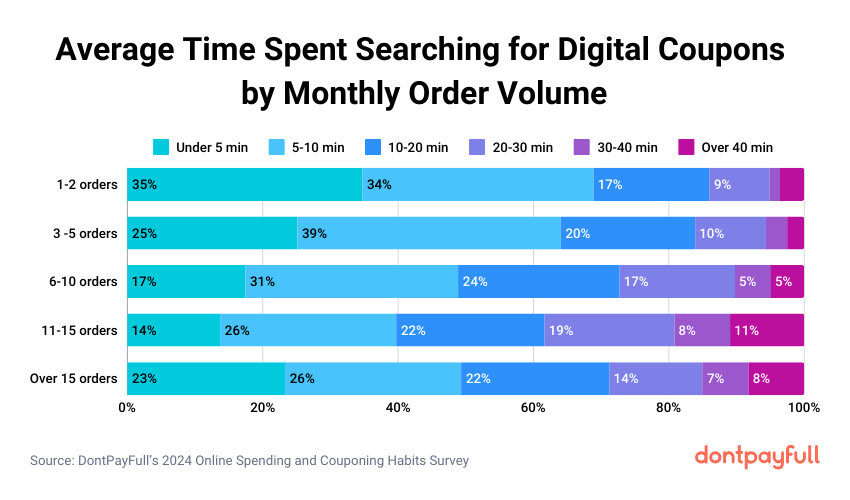
Time Spent Searching for Coupons Online by Monthly Order Volume
✏️
Note: The majority of respondents purchase online 3-5 times a month. 39% of them look for a coupon for 5-10 minutes each time.
Shoppers who buy online 11-15+ times a month are the likeliest to spend over an hour looking for a coupon. On the flip side, people purchasing online only once or twice a month predominantly spend at most 10 minutes looking for coupons (with 35% spending less than 5 minutes).
Still, the actual difference isn’t that high. 5% of those making over 15 purchases per month look for coupons for more than an hour, versus 2% of those making 1-2 purchases a month. However, there’s another interesting pattern worth looking at. As the number of monthly purchases increases from 1-2 to 6-10 and over 15, there is a sizable increase in the percentage of respondents spending 10-20 minutes and 20-30 minutes looking for coupons.
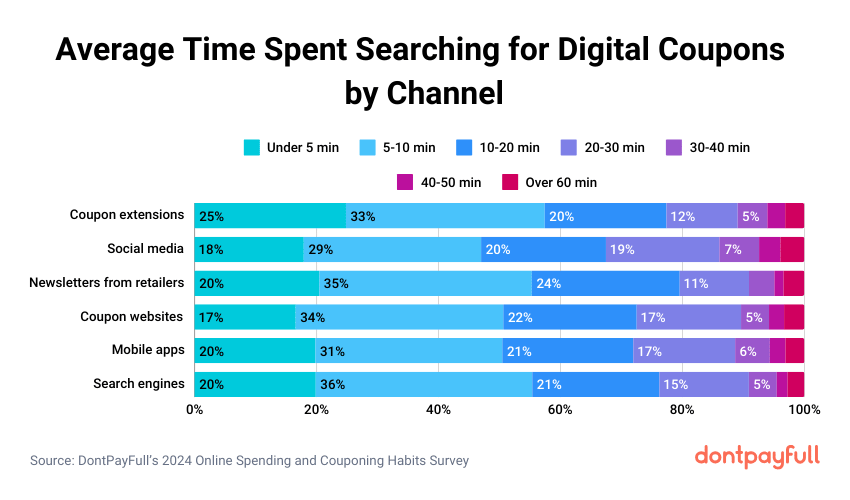
Time Spent Searching for Coupons Online by Channel
Most people spend a short amount of time searching for coupons when shopping online. Over half of respondents (54%) spend less than 10 minutes looking for coupons per shopping session.
- 3-4% of customers spend over an hour hunting for coupons. Most people coupon hunting for over 60 minutes do so on social media. Social media also has a higher percentage of people (19%) spending 20-30 minutes searching for coupons compared to other tools. This indicates that customers might get engaged with content or discussions while looking for coupons on these platforms.
- Browser extensions and search engines are the most popular tools for searching for coupons quickly, with around 1 in 4 people spending less than 5 minutes when using these methods. For example, 25% of respondents spend less than 5 minutes searching for coupons with a browser extension.
- 35% of people spend just 5-10 minutes searching retailer emails for relevant coupons. Coupon websites are in the same boat, with 34% of respondents spending the same amount of time on this platform to look for codes.
- Most respondents spend an average of 5-10 minutes coupon hunting across all online platforms.
Online Couponing Success Rates
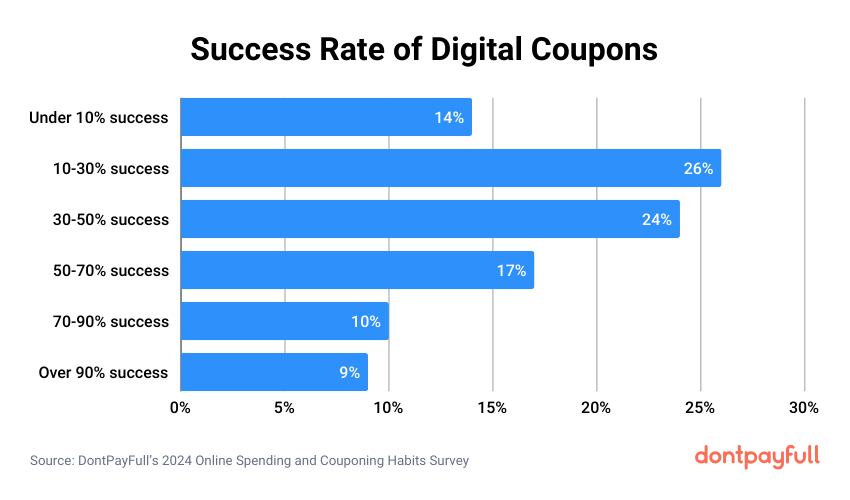
Half of the survey respondents usually struggle to find an online coupon that actually works. Most shoppers (26%) only find working coupons 10-30% of the time, while 24% of shoppers find working coupons 30-50% of the time.
Here’s how often the digital coupons that our respondents use actually work:
- Under 10% success: 14%
- 10-30% success: 26%
- 30-50% success: 24%
- 50-70% success: 17%
- 70-90% success: 10%
- Over 90% success: 9%
✏️
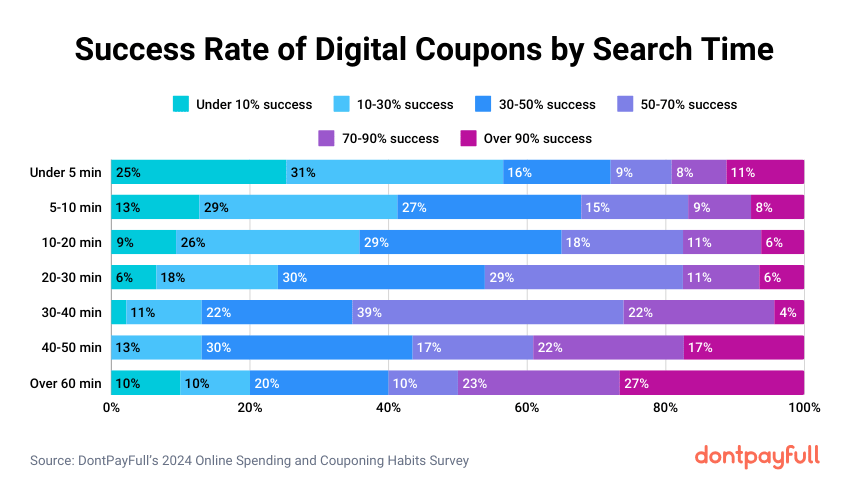
Note: People who spend more time searching for coupon codes tend to find working ones more often. Those who spend over 40 minutes looking for coupons find a working code 50-90% of the time or more. In contrast, those who spend less than 5 minutes searching only find a working coupon code 10-30% of the time.
Online Couponing Success Rates by Search Time
- 27% of people who spend over an hour looking for coupons find a working code over 90% of the time.
- 39% of people who spend 30-40 minutes find working codes 50-70% of the time.
- 30% of people who spend 20-30 minutes searching find working codes 30-50% of the time.
The data shows that the more time a customer invests in looking for coupons, the likelier it is to find a working one. Even spending 10-20 minutes searching for coupons makes a big difference compared to those who spend less than 5 minutes.
✏️
Note: The ideal tactic seems to be spending 30-50 minutes looking for coupons, with a majority in this group finding working codes 50-90% of the time. Casual coupon users who spend under 10 minutes coupon hunting will likely only find a working code less than 30% of the time.
Online Couponing Success Rates by Platform
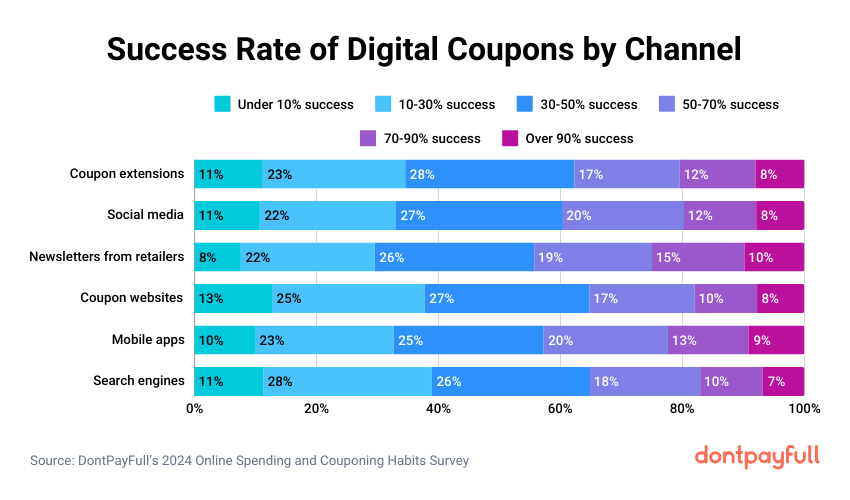
Overall, taking all online channels into consideration, coupons work 30-50% of the time for most shoppers, as indicated by 24-28% of respondents for each channel. However, the second likeliest scenario is that coupons will only work 10-30% of the time for all platforms.
Amount of codes working 30-50% of the time by platform:
- Browser extensions: 28%
- Coupon websites: 27%
- Mobile apps: 24%
- Newsletters from retailers: 26%
- Search engines: 26%
- Social media: 27%
Interestingly, search engines are the likeliest to result in codes that only work 10-30% of the time (28% of cases), while coupon websites are the likeliest to have codes that work less than 10% of the time (13% of cases).
✏️
Note: Perhaps unsurprisingly, newsletters from retailers have the highest percentage of codes working over 90% of the time (for 10% of respondents). Mobile apps come in second place with 9% of codes working over 90% of the time.
How Shoppers Find Digital Coupons
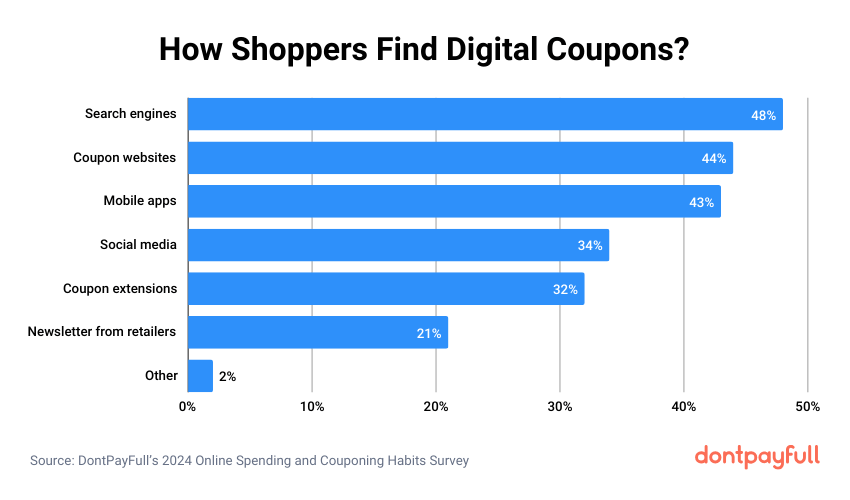
There’s a fairly even split between the 3 main ways our respondents find digital coupons, but the main method (for 48% of people) is looking for discount codes via search engines. These platforms include Google, Bing, Yahoo, DuckDuckGo, and so on. Please bear in mind that survey participants selected all applicable methods via which they find coupons.
Here’s how many customers use each digital channel to find promo codes:
- Search engines: 48%
- Coupon websites: 44%
- Mobile apps: 43%
- Social media: 34%
- Coupon extensions: 32%
- Newsletter from retailers: 21%
- Other: 2%
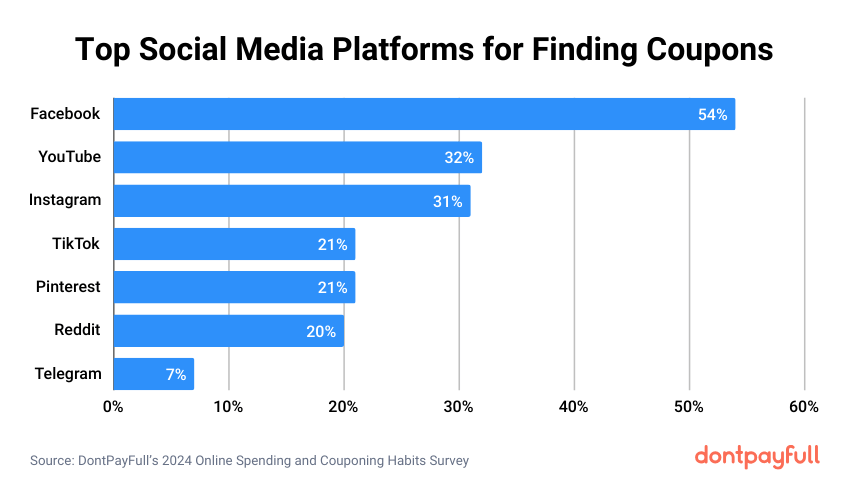
Top Social Media Platforms for Finding Coupons
Some customers actively search for discount codes on social media. Out of this group, most people find coupons on Facebook (54%), YouTube (32%), and Instagram (29%). The vast number of active users on these 3 platforms surely plays a key role versus the more specialized or niche audiences of TikTok, Reddit, Pinterest, and Telegram.
However, it might also suggest that the content presentation styles of Facebook, YouTube, and Instagram are better suited to allow brands to create visually appealing coupon ads and posts. In contrast, platforms like Reddit prioritize text-based content, which may not be as effective.
✏️
Note: The data reveals interesting generational differences where people find coupons on social media. Facebook is most popular among Gen X (31%) and Millennials (38%), while TikTok is favored by Gen Z (37%) and Millennials (41%). Reddit and YouTube skew heavily toward Millennials (45% and 37% respectively).
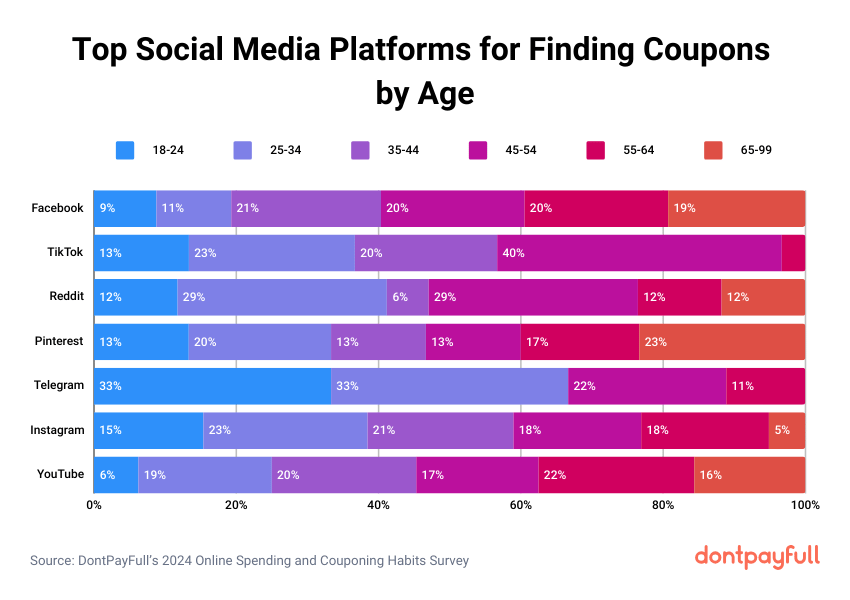
Top Social Media Platforms for Finding Coupons by Age
Overall, the data shows that Millennials are the most active generation when it comes to finding coupons on social media, leading usage on 5 out of the 7 platforms surveyed. Baby Boomers and the Silent Generation tend to have the lowest usage across platforms. Telegram stands out as being especially popular with Millennials, with nearly 60% of Telegram coupon finders falling into that generation.
✏️
Note: Some customers do not actively search for coupon codes on social media. They come across them via passive exposure while browsing their timeline or searching for other content.
Initially, our survey had 1,505 people in it. However, 225 of them said that they do not actively search for coupons, and we thus eliminated them from the main findings. Still, we found it interesting to see how they interact with coupons as well, which turned out to be focused on social media.
Below, you’ll find the data corresponding only to the 225 people not represented in our other findings.
- Women are more likely than men to come across coupons on Facebook (56% vs 44%) and Pinterest (60% vs 40%). However, men are more likely to see coupons on platforms like Reddit (65% male), Telegram (67% male), Instagram (59% male) and YouTube (63% male). TikTok has an even 50/50 split.
- As expected, TikTok and Telegram are most popular with our youngest demographic, with a third of coupon finders on those platforms being aged 18-24. Reddit also has a young user base, with 41% aged 18-34. Pinterest and Facebook skew older, with around 40% aged 55+. YouTube and Instagram fall somewhere in the middle in terms of age.
- One surprising finding is that the 45-54 age group is most likely to find coupons on TikTok (40%), even more so than younger groups. This goes against the perception of TikTok as an app primarily for teens and young adults.
✏️
Note: From this point onwards, we’ll refer to the main study group (1,280 people) once again.
Cart Abandonment Frequency If No Coupon Is Found
If they cannot find a coupon code for their cart, respondents might give up on their online purchase. 5% of them will always give up on their purchase because they didn’t find a discount, while 15% will never do so.
- 5% of respondents will “always” abandon their cart without a discount.
- 10% of respondents will “often” abandon their cart without a discount.
- 33% of respondents will “sometimes” abandon their cart without a discount.
- 37% of respondents will “rarely” abandon their cart without a discount.
- 15% of respondents will “never” abandon their cart without a discount.
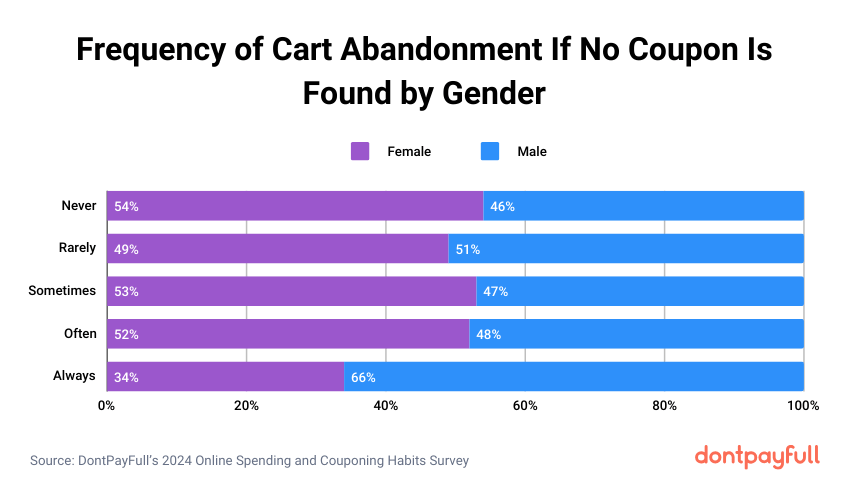
Cart Abandonment Frequency If No Coupon Is Found by Gender
Men are nearly twice as likely as women to always abandon their shopping cart when they can’t find a digital coupon (66% vs 34%). Women are more likely than men to never abandon a cart due to not finding coupons (54% vs 46%).
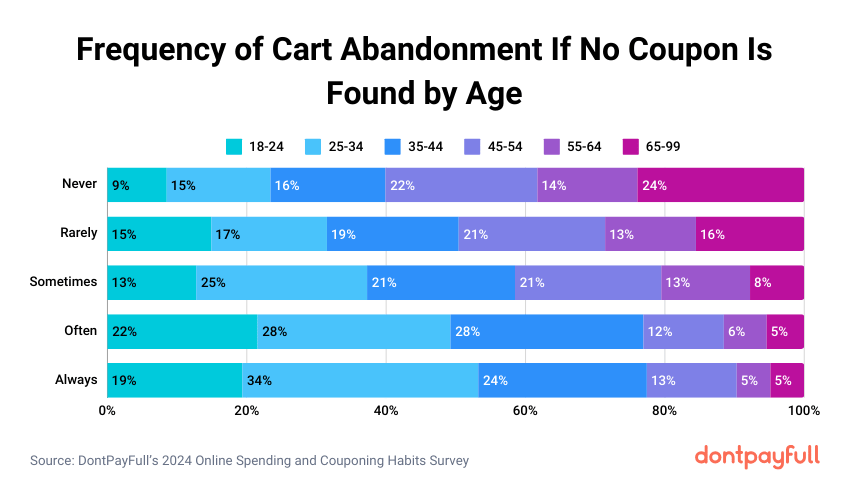
Cart Abandonment Frequency If No Coupon Is Found by Age
The age group 25-34 is the most likely to always abandon their cart (8%), with the likelihood of never abandoning a cart increasing with age, peaking at the 65-99 age group (33%). Young men (18-24) are the most likely to always abandon their cart, while senior women (65-99) are the least likely.
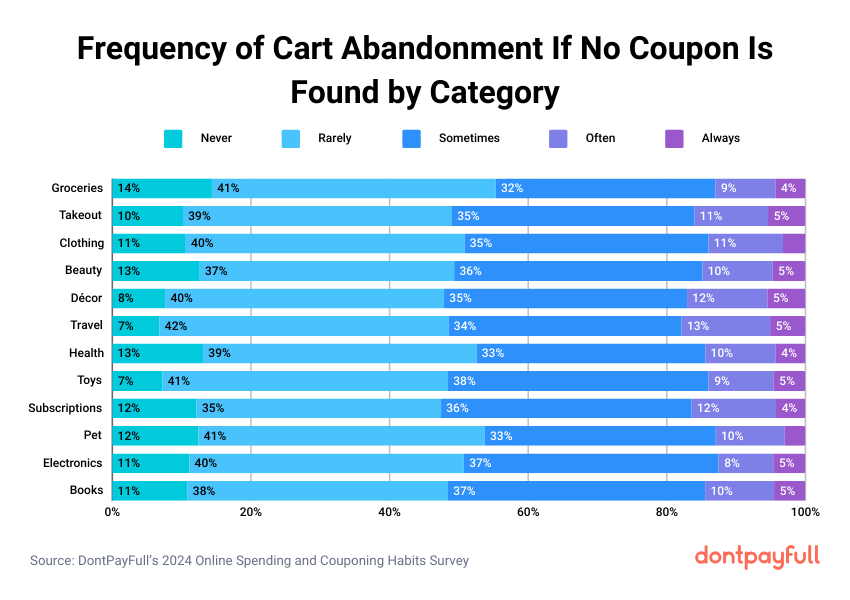
Cart Abandonment Frequency If No Coupon Is Found by Category
Customers are likely to abandon their shopping cart across all product categories, with only 6-15% saying they’d “never” drop the purchase because they can’t find a discount.
- Travel (7%), home decor (8%), and toys/games (7%) had the lowest rates of “never” abandoning. This suggests coupons are especially important for discretionary and big-ticket purchases.
- On the flip side, groceries (14%), health (13%), and pet items (12%) had the highest rates of “never” abandoning. This indicates that for essential purchases, people are less likely to abandon their carts. However, even in these categories, over 85% of shoppers would at least “sometimes” abandon purchases when they can’t find a coupon.
- Groceries & meal kits and health also have relatively low “always” abandonment rates (4% in both cases). This reinforces the reasoning described above.
- “Always” cart abandonment is highest for takeout food (5%) and home decor products (5%). This might suggest a higher sensitivity to prices or deals in these categories.
- Electronics & gadgets (37%) and toys, video games & games (38%) have the highest percentage of respondents who “sometimes” abandon carts. This is indicative of the non-essential nature of the products, while they still hold sufficient value for customers to purchase at full price as well.
Who We Surveyed
- The survey respondents are roughly evenly spread between Generations X and Y, which are the majority of our respondents (with fewer members of Generation Z being present as well). 21% are 25-34 years old, 20% are 35-44, and 20% are 45-54.
- 49% of survey respondents are men, and 51% are women.
- 57% of respondents have completed a higher form of education, and all respondents have at least a high school degree.
- 66% of respondents were employed in some way at the time of the survey, 14% were retired, 15% were unemployed, and 5% were students.
- Most respondents have a household income of $50,000-$99,999 per year, while 24% earn less than $25,000 in their household. 19% earn more than $100,000 per year.
- Most respondents were either single (38%) or married (37%) at the time of the survey.
- Most respondents either did not have children (44%), had 1 child (21%), or had 2 children (21%) at the time of the survey.
Survey Raw Data Request
Want to look at the coupon statistics data yourself? Just click the button below and tell us your email address and what you need the data for. We’ll then give you the questions and answers in CSV format.
Want to Learn More?
If you’ve found the coupon statistics insights, we’re happy to tell you that there’s more where they came from! Continue exploring online shopping and couponing habits by reading all parts of our study:
- Online Shopping Statistics
- Online Couponing Trends & Statistics (you are here)
- Digital Couponing Habits
Do You Have Any Suggestions?
We're always looking for ways to enrich our content on DontPayFull.com. If you have a valuable resource or other suggestion that could enhance our existing content, we would love to hear from you.
Was this content helpful to you?
Related Articles