5.00 out of 5 votes

Online Shopping Statistics
 By Razvan PopescuUpdated 6 min read
We all know that online shopping is popular, but have you ever wondered why that is? In this consumer behavior report, we explore how and why people buy online. The data below reflects answers from a survey we conducted of 1,280 shoppers from the United States via MakeOpinion.com. This is the first article in the series, focusing on online shopping statistics.
⚠️
Attention: This is part 1 of 3 of our series covering digital spending and couponing habits in 2024. The insights were gathered via a survey of 1,280 consumers from the United States. Check out all parts of our research, or continue reading the full details below.
- Online Shopping Statistics (you are here)
- Online Couponing Trends & Statistics
- Digital Couponing Habits
Online Shopping Statistics: Key Takeaways
- Most customers like shopping online because it’s convenient, available 24/7, and it saves them time. Other popular reasons include free shipping options and a wide variety of products. While convenience is the driving factor, having better prices online, as well as better discounts and deals, were top-of-mind reasons too.
- On average, most respondents make 3 to 5 online purchases a month (37%), while 31% purchase online 1-2 times a month.
- Most respondents spend an average of $50-$100 every month on online purchases (25%), while 19% spend under $50, and 16% spend $100-$150.
- Most respondents predominantly buy clothing & accessories, electronics & gadgets, and health & wellness products online.
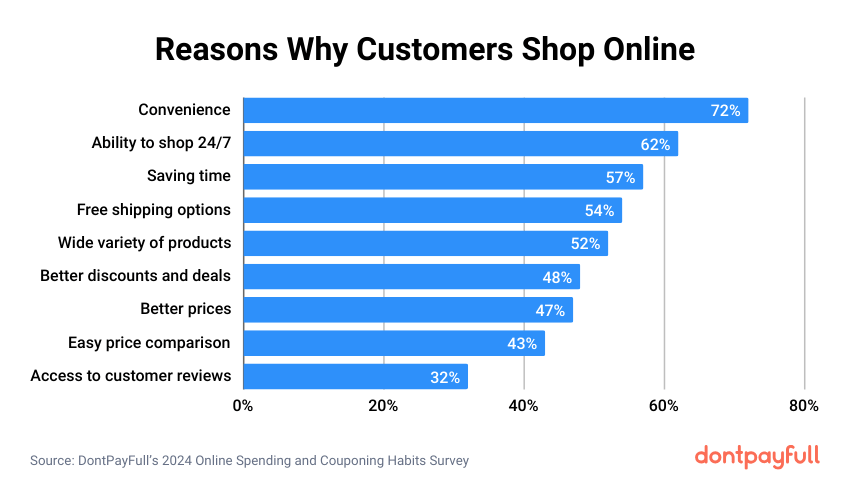
Why People Shop Online
For this question, respondents selected all applicable answers, as there can be multiple reasons why a consumer chooses to buy digitally. The most popular reasons were:
- Convenience
- Ability to shop 24/7
- Saving time
✏️
Note: There’s a clear pattern between the top 3 reasons, as they all correlate with shoppers having limited time and energy to spend on purchasing items.
For example, in 2019, the average person spent around 4.5 hours per week commuting to and from work (U.S. Census Bureau’s American Community Survey). That’s over half the time that the average employed person in the U.S. spent at work daily in 2022 (8 hours, according to the U.S. Bureau of Labour Statistics).
✏️
Note: This logic can be reinforced by looking at the fourth and fifth reasons too, which are free shipping options and a wide array of products.
Convenience Is Key
Essentially, customers love finding pretty much whatever they need online easily and getting it shipped to their door free of charge.
Last, but not least, the bottom-tier answers are all tied to price in some way and have roughly the same fairly high percentage (in the 40s). This proves that convenience is the driving factor for customers deciding to buy online, but the ability to spend less than in-store is also highly important.
The full breakdown of reasons consumers shop online:
- Convenience: 72%
- Ability to shop 24/7: 61%
- Saving time: 57%
- Free shipping options: 54%
- Wide variety of products: 52%
- Better discounts and deals: 48%
- Better prices: 47%
- Easy price comparison: 43%
- Access to customer reviews: 32%
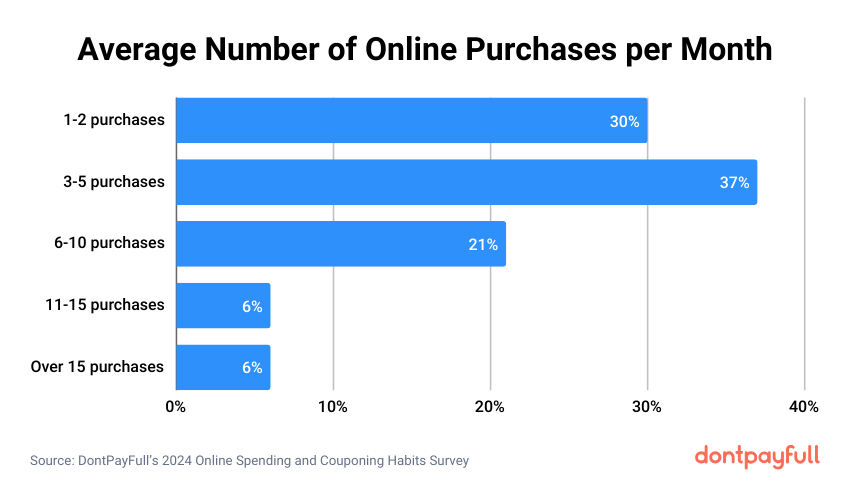
Average Monthly Online Purchases
On average, most respondents make 3 to 5 online purchases per month (37%), while 31% of respondents purchase online once or twice every month. 12% make between 11-15+ online purchases every month.
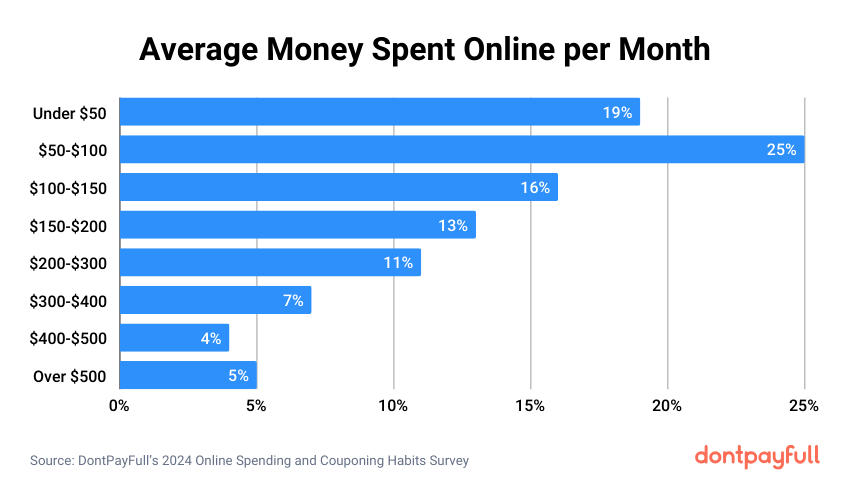
Average Monthly Online Spending
As for how much they spend, most people buy products online worth an average of $50-$100 every month (25%). The full breakdown is as follows:
- Under $50: 19%
- $50-$100: 25%
- $100-$150: 16%
- $150-$200: 13%
- $200-$300: 11%
- $300$400: 7%
- $400-$500: 4%
- Over $500: 5%
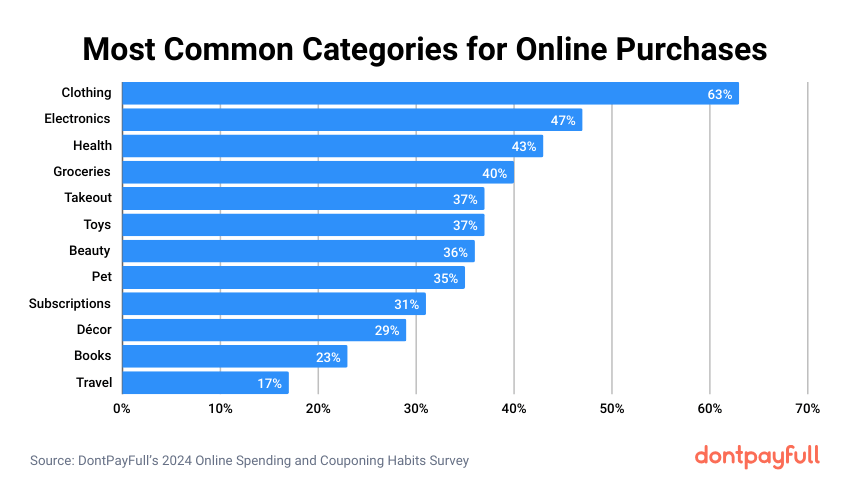
Product Categories Bought Online
For this question, respondents were asked to check all applicable answers since it is likely that people buy multiple product types every month. The most popular items bought online, as per our survey results, are:
- Clothing and accessories
- Electronics and gadgets
- Health and wellness products
The full breakdown is:
- Clothing and accessories: 63%
- Electronics and gadgets: 47%
- Health and wellness products: 43%
- Groceries and meal kits: 40%
- Takeout food: 37%
- Toys, games, and video games: 37%
- Beauty products: 36%
- Pet items: 35%
- Digital subscriptions and services: 31%
- Home decor products: 29%
- Books and e-books: 23%
- Travel products and services: 17%
Interpreting Spending Patterns
✏️
Note: Most respondents are in the lower spending categories – under $50 a month and up to $150. Still, the top 3 product categories can seem expensive at first look: clothes, electronics, health. However, these categories include both products that can cost $10, such as a basic T-shirt, as well as high-end designer dresses worth $1,000+.
Let’s consider two things:
- Most respondents make 3-5 purchases or 1-2 purchases per month.
- A significant portion of respondents indicated that they purchase takeout food and groceries & meal kits online each month. According to the U.S. Bureau of Labor Statistics’ Consumer Expenditure Survey (2021), the average American household spends around $89 per week on grocery shopping and $67 per week on takeout, delivery, or dining out.
Given the data so far about online shopping statistics, it is within reason to infer that our respondents might buy a combination of food and clothes, electronics, or health products online monthly, with a lower cost per transaction. Alternatively, they could be purchasing higher-value products from the clothes, electronics, or health categories less often during a month.
Who We Surveyed
- The survey respondents are roughly evenly spread between Generations X and Y, which are the majority of our respondents (with fewer members of Generation Z being present as well). 21% are 25-34 years old, 20% are 35-44, and 20% are 45-54.
- 49% of survey respondents are men, and 51% are women.
- 57% of respondents have completed a higher form of education, and all respondents have at least a high school degree.
- 66% of respondents were employed in some way at the time of the survey, 14% were retired, 15% were unemployed, and 5% were students.
- Most respondents have a household income of $50,000-$99,999 per year, while 24% earn less than $25,000 in their household. 19% earn more than $100,000 per year.
- Most respondents were either single (38%) or married (37%) at the time of the survey.
- Most respondents either did not have children (44%), had 1 child (21%), or had 2 children (21%) at the time of the survey.
Survey Raw Data Request
Want to look at the data yourself? Just click the button below and tell us your email address and what you need the data for. We’ll then give you the questions and answers in CSV format.
Want to Learn More?
If you’ve found the insights interesting, we’re happy to tell you that there’s more where they came from! Continue exploring online shopping and couponing habits by reading all parts of our study:
- Online Shopping Statistics (you are here)
- Online Couponing Trends & Statistics
- Digital Couponing Habits
Do You Have Any Suggestions?
We're always looking for ways to enrich our content on DontPayFull.com. If you have a valuable resource or other suggestion that could enhance our existing content, we would love to hear from you.
Was this content helpful to you?
Related Articles